Python for AI: Full lesson content.
# Environment
## Virtual Environments [Section titled “Virtual Environments”](#virtual-environments) Virtual environments (venv) isolate your project’s dependencies from the system Python so different projects don’t conflict. Create and activate a venv: ```sh # Create a venv in the .venv folder (convention) python -m venv .venv # On Windows Command Prompt .venv\Scripts\Activate.bat # On Windows PowerShell .venv\Scripts\Activate.ps1 # Activate (macOS/Linux) source .venv/bin/activate # Verify python -V ``` Deactivate with `deactivate`. ```sh # Activate (macOS/Linux) source .venv/bin/deactivate # On Windows PowerShell # .venv\Scripts\Deactivate.ps1 ``` ## Installing Packages (pip) [Section titled “Installing Packages (pip)”](#installing-packages-pip) * [PyPI - The Python Package Index](https://pypi.org/) Install, upgrade, uninstall: ```sh pip install numpy pip install --upgrade pip pip uninstall numpy ``` Freeze your current environment to a requirements file: ```sh pip freeze > requirements.txt ``` Install from a `requirements.txt`: ```sh pip install -r requirements.txt ``` ## Running Modules [Section titled “Running Modules”](#running-modules) Use the `-m` flag to run installed modules and ensure the correct interpreter is used: ```sh python -m http.server 8000 ``` ## Common Workflows [Section titled “Common Workflows”](#common-workflows) ```sh # 1) Create project and venv mkdir myapp && cd myapp python -m venv .venv source .venv/bin/activate # 2) Install deps pip install numpy # 3) Save exact versions pip freeze > requirements.txt # 4) Recreate env later venv .venv source .venv/bin/activate pip install -r requirements.txt ``` ## Jupyter Notebook + VS Code [Section titled “Jupyter Notebook + VS Code”](#jupyter-notebook--vs-code) ## Extensions [Section titled “Extensions”](#extensions) * * ## Optional Extensions [Section titled “Optional Extensions”](#optional-extensions) * ## JupyterLab [Section titled “JupyterLab”](#jupyterlab) JupyterLab is the next-generation web interface for Jupyter notebooks, consoles, and file management. ### Install [Section titled “Install”](#install) ```sh pip install jupyterlab ``` ### Run [Section titled “Run”](#run) ```sh # Start JupyterLab (opens in your browser) jupyter lab ``` * If the browser does not open, copy the token URL printed in the terminal to your browser. ### Stop [Section titled “Stop”](#stop) * Stop the server with `Ctrl+C` in the terminal. ## Google Colab [Section titled “Google Colab”](#google-colab) * [Google Colab](https://colab.research.google.com/) Free, cloud-based platform that allows users to write and execute Python code in a Jupyter Notebook environment.
# Exercises
A collection of graded practice tasks covering the fundamentals. 1. Print the following output, maak gebruik van variables, schrijf een list en loop voor de hobbies: ```sh Mijn naam is Ner en mijn hobbies zijn: - Programmeren - Koken - Travelen ``` 2. Bereken je leeftijd, maak gebruik van variables en cijfers: ```sh Ik ben nu 20 jaar en - over 5 jaren ben ik ... jaar - over 10 jaren ben ik ... jaar ``` 3. Schrijf je voornaam in een variable en geef aan hoeveel letters in jouw naam zijn. ```sh Ik heet Ner en ik heb 3 letters in mijn naam. ``` 4. Maak een dictionary met 3 vakken en tentamen cijfers van de vorige semesters en tenslotte bereken het gemiddelde: ```sh Java & DB: 9.9 System Design: 9.7 Algo & DS: 10 --- Gemiddelde: 9.8 ``` 5. Schrijf een programma die alleen even getallen van 0-10 aangeeft, maak gebruik van een loop en if conditions: ```sh 2 4 6 8 10 ``` 6. Schrijf een function die 2 parameters neemt (koers en bedrag) en die deze output geeft: ```sh USD 1 = SRD 38.70 USD 25 = SRD 967.5 EUR 1 = SRD 42.50 EUR 40 = SRD 1700 ```
# Python Fundamentals
Python is a dynamic, interpreted (bytecode-compiled) language. There are no type declarations of variables, parameters, functions, or methods in source code. This makes the code short and flexible, and you lose the compile-time type checking of the source code. Python tracks the types of all values at runtime and flags code that does not make sense as it runs. ## Source code [Section titled “Source code”](#source-code) Python source files use the “.py” extension and are called “modules.” With a Python module hello.py, the easiest way to run it is with the shell command “python hello.py Alice” which calls the Python interpreter to execute the code in hello.py, passing it the command line argument “Alice”. Here’s a very simple hello.py program: ```py # import modules used here -- sys is a very standard one import sys # Gather our code in a main() function def main(): print('Hello', sys.argv[1]) # Command line args are in sys.argv[1], sys.argv[2] ... # sys.argv[0] is the script name itself and can be ignored # Standard boilerplate to call the main() function to begin # the program. if __name__ == '__main__': main() ``` Running this program from the command line looks like: ```sh python3 hello.py Ner ``` You can also use the interactive REPL by running `python3` and typing expressions line by line. Press Ctrl+D (macOS/Linux) or Ctrl+Z then Enter (Windows) to exit. ## Variables and Types [Section titled “Variables and Types”](#variables-and-types) * Variables are created by assignment; the type is inferred at runtime. * Common built-in types: `int`, `float`, `bool`, `str`, `list`, `tuple`, `set`, `dict`, `NoneType`. * Use `type(x)` to inspect a value’s type. ```py x = 42 # int y = 3.14 # float flag = True # bool name = "Ner" # str data = None # NoneType (represents “no value”) print(type(x), type(y), type(flag), type(name), type(data)) ``` Numbers support standard arithmetic, integer division (`//`), modulo (`%`), and exponentiation (`**`). ```py 7 // 3 # 2 7 % 3 # 1 2 ** 5 # 32 ``` Comparison and boolean operators: `== != < <= > >=` and `and or not`. Remember that `==` compares values, while `is` compares object identity. ## User-defined Functions [Section titled “User-defined Functions”](#user-defined-functions) Functions in Python are defined like this: ```py # Defines a "repeat" function that takes 2 arguments. def repeat(s, exclaim): """ Returns the string 's' repeated 3 times. If exclaim is true, add exclamation marks. """ result = s + s + s # can also use "s * 3" which is faster (Why?) if exclaim: result = result + '!!!' return result def main(): print(repeat('Yay', False)) ## YayYayYay print(repeat('Woo Hoo', True)) ## Woo HooWoo HooWoo Hoo!!! ``` More function features: ```py def greet(name="world"): # default argument return f"Hello, {name}!" def add(*nums): # variable positional args return sum(nums) def configure(**options): # variable keyword args return options def area(w: float, h: float) -> float: # type hints (annotations) return w * h print(greet()) # Hello, world! print(add(1, 2, 3)) # 6 print(configure(debug=True)) # {'debug': True} ``` Docstrings (triple-quoted strings right after `def`) are the canonical place to document functions and are accessible via `help(func)`. ## Indentation [Section titled “Indentation”](#indentation) One unusual Python feature is that the whitespace indentation of a piece of code affects its meaning. A logical block of statements such as the ones that make up a function should all have the same indentation, set in from the indentation of their parent function or “if” or whatever. If one of the lines in a group has a different indentation, it is flagged as a syntax error. Python’s use of whitespace feels a little strange at first, but it’s logical and I found I got used to it very quickly. Avoid using TABs as they greatly complicate the indentation scheme (not to mention TABs may mean different things on different platforms). Set your editor to insert spaces instead of TABs for Python code. ## Strings [Section titled “Strings”](#strings) Strings are sequences of Unicode characters. * Literals: single quotes `'...'`, double quotes `"..."`, or triple quotes for multi-line `'''...'''` / `"""..."""`. * Escape sequences: `\n` newline, `\t` tab, `\uXXXX` Unicode, or use raw strings `r"C:\\path"` to avoid escapes. * Concatenate with `+`, repeat with `*`, and interpolate with f-strings `f"...{expr}..."`. ```py s = "hello" t = 'world' u = s + ' ' + t # "hello world" v = s * 3 # "hellohellohello" name = "Ner" msg = f"Hi {name}!" # f-string ``` Indexing, slicing, and common methods: ```py text = "Python" text[0] # 'P' text[-1] # 'n' text[1:4] # 'yth' text[::-1] # 'nohtyP' (reversed) text.lower() # 'python' text.upper() # 'PYTHON' " spaced ".strip() # 'spaced' "a,b,c".split(',') # ['a', 'b', 'c'] "-".join(["a","b"]) # 'a-b' ``` ## Lists [Section titled “Lists”](#lists) Lists are ordered, mutable collections. ```py nums = [1, 2, 3] nums.append(4) # [1, 2, 3, 4] nums.extend([5, 6]) # [1, 2, 3, 4, 5, 6] nums.insert(0, 0) # [0, 1, 2, 3, 4, 5, 6] nums.remove(3) # removes first 3 last = nums.pop() # pops 6 nums[1:4] # slice [1, 2, 3] ``` Sorting and safe copies: ```py data = [3, 1, 2] data.sort() # in-place -> [1, 2, 3] sorted(data, reverse=True) # returns new list -> [3, 2, 1] ``` List comprehensions are concise ways to build lists: ```py squares = [n*n for n in range(5)] # [0, 1, 4, 9, 16] evens = [n for n in range(10) if n % 2 == 0] # [0, 2, 4, 6, 8] ``` Looping patterns: ```py for i, value in enumerate(["a","b","c"], start=1): print(i, value) ``` ## Dictionaries [Section titled “Dictionaries”](#dictionaries) Dictionaries map keys to values and are very fast for lookups. ```py person = {"name": "Ada", "age": 36} person["job"] = "Engineer" person["age"] += 1 person.get("missing") # None (safe) person.get("missing", 0) # default value 0 for k, v in person.items(): print(k, v) ``` Dictionary comprehension: ```py square_map = {n: n*n for n in range(5)} # {0:0, 1:1, 2:4, 3:9, 4:16} ``` Keys must be hashable (immutable types like `str`, `int`, `tuple`). ## Tuples and Sets [Section titled “Tuples and Sets”](#tuples-and-sets) ```py # Tuple: ordered, immutable pt = (10, 20) x, y = pt # unpacking # Set: unordered collection of unique items colors = {"red", "green", "blue", "red"} # {'red', 'green', 'blue'} colors.add("yellow") primary = {"red", "green", "blue"} warm = {"red", "yellow"} primary & warm # intersection -> {'red'} primary | warm # union -> {'red', 'green', 'blue', 'yellow'} ``` ## Control Flow [Section titled “Control Flow”](#control-flow) ```py x = 7 if x < 0: print("negative") elif x == 0: print("zero") else: print("positive") for n in range(3): if n == 1: continue print(n) count = 3 while count > 0: print(count) count -= 1 ``` Truthiness: empty collections, `0`, and `None` are “falsy”; most other values are “truthy”. ## Comprehensions [Section titled “Comprehensions”](#comprehensions) ```py # list cubes = [n**3 for n in range(5)] # dict index = {word: i for i, word in enumerate(["a","b","c"])} # set unique_lens = {len(w) for w in ["aa","b","ccc","aa"]} # {1, 2, 3} ``` ## Exceptions [Section titled “Exceptions”](#exceptions) ```py try: value = int("42") except ValueError as e: print("Not a number:", e) else: print("Converted successfully") finally: print("Always runs") # Raising your own def sqrt(x): if x < 0: raise ValueError("x must be non-negative") return x ** 0.5 ``` ## File I/O [Section titled “File I/O”](#file-io) ```py # Reading a text file with open("notes.txt", "r", encoding="utf-8") as f: text = f.read() # Writing (overwrites) with open("out.txt", "w", encoding="utf-8") as f: f.write("Hello, file!\n") # Append with open("out.txt", "a", encoding="utf-8") as f: f.write("More text\n") ``` ## Style and Tips [Section titled “Style and Tips”](#style-and-tips) * Follow PEP 8 (indent with 4 spaces, `snake_case` for variables/functions, `CapWords` for classes). * Prefer f-strings for formatting. * Use list/dict/set comprehensions for concise transformations. * Handle errors explicitly with `try/except`. * Keep functions small and focused; document with docstrings. ## Practice [Section titled “Practice”](#practice) Ready to apply what you learned? Try these: [Python Practice Exercises](../python/exercises)
# Python voor AI
> Introductie tot Python voor AI
Welkom bij het programmaonderdeel Python voor AI. ## Leerdoelen [Section titled “Leerdoelen”](#leerdoelen) 1. De fundamentele concepten van Python toepassen. 2. Python libraries voor machine learning gebruiken. 3. Data visualiseren met behulp van Python 4. Een AI-bot in Python bouwen. 5. De wijze waarop een AI-bot in Python is gebouwd, verslaan, presenteren en verantwoorden. ## Overzicht [Section titled “Overzicht”](#overzicht) * [Setup](/python/setup) * [Fundamentals](/python/fundamentals) * [Environment](/python/environment) * [Libraries](/python/libraries) ## Bronnen [Section titled “Bronnen”](#bronnen) * [Google’s Python Class](https://developers.google.com/edu/python/)
# Iris Flower Classification
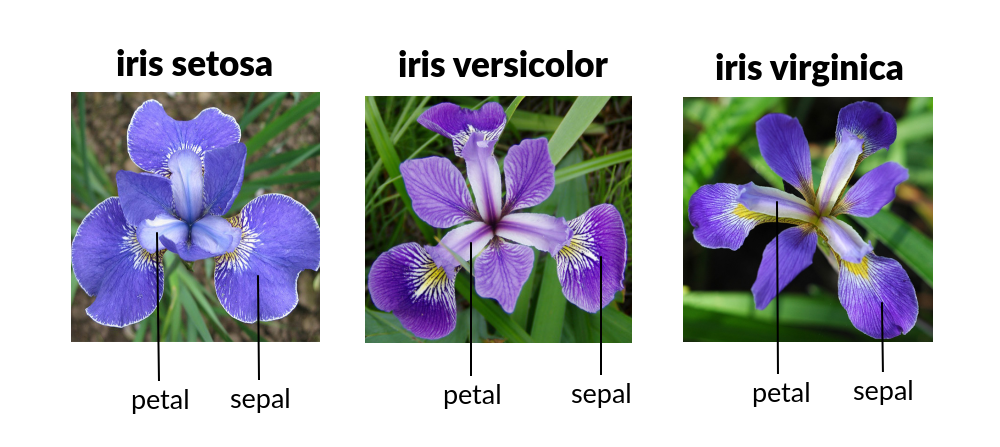 ### **1. Overzicht** [Section titled “1. Overzicht”](#1-overzicht) **Doel:** We bouwen onze eerste Machine Learning (ML) programma. We leren een computer te trainen om verschillende soorten Iris-bloemen te classificeren op basis van hun fysieke afmetingen. **Waarom dit onderwerp?** * **Intuïtieve Data:** De data bestaat uit fysieke metingen (lengte/breedte) die makkelijk te visualiseren zijn. * **Clean Dataset:** We gebruiken de beroemde “Iris Dataset” die is ingebouwd in Python, waardoor we complexe *data cleaning* vermijden. * **Duidelijk Doel:** De doelstelling is simpel: classificeer een bloem in één van de drie categorieën (Setosa, Versicolor of Virginica). ### **2. Kernconcepten** [Section titled “2. Kernconcepten”](#2-kernconcepten) Voordat we gaan coderen, behandelen we de vier pijlers van **Supervised Learning**: 1. **Features (Inputs):** De data die we *hebben* (Sepal Length, Sepal Width, Petal Length, Petal Width). 2. **Labels (Outputs):** Het antwoord dat we willen *voorspellen* (De naam van de soort). 3. **Het Algoritme (K-Nearest Neighbors):** * *Concept:* “Als het eruitziet als een eend en loopt als een eend, is het waarschijnlijk een eend.” * *Wiskunde:* Als een nieuwe bloem afmetingen heeft die lijken op de “Setosa” bloemen die we eerder hebben gezien, classificeert de computer deze als een Setosa. 4. **Train/Test Split:** De “Gouden Regel” van ML. We testen het model nooit op dezelfde vragen die ze bestudeerd hebben (de training data). We verbergen 20% van de data voor het eindexamen. ### **3. Deel I: De Core Logic** [Section titled “3. Deel I: De Core Logic”](#3-deel-i-de-core-logic) ```sh pip install scikit-learn ``` ```py import sklearn; sklearn.show_versions() ``` ```py from sklearn.datasets import load_iris from sklearn.model_selection import train_test_split from sklearn.neighbors import KNeighborsClassifier from sklearn.metrics import accuracy_score # 1. Laad de Data iris = load_iris() f = iris.data # De metingen (Features) [sepal lengte, sepal breedte, petal lengte, sepal breedte] l = iris.target # De soort (Labels) # 2. Split de Data (80% om te studeren, 20% voor het examen) f_train, f_test, l_train, l_test = train_test_split(f, l, test_size=0.2, random_state=42) # 3. Initialiseer het Model # We kijken naar de 3 'nearest neighbors' om een beslissing te nemen model = KNeighborsClassifier(n_neighbors=3) # 4. Train het Model (Fit) model.fit(f_train, l_train) # 5. Maak Voorspellingen (Predictions) predictions = model.predict(f_test) # 6. Beoordeel het Model score = accuracy_score(l_test, predictions) print(f"Model Accuracy: {score * 100}%") ``` ### **4. Deel II: Visualisatie** [Section titled “4. Deel II: Visualisatie”](#4-deel-ii-visualisatie)  * Het “Setosa” cluster (Rood) is ver verwijderd van de anderen, waardoor het heel makkelijk te identificeren is. * Waar Groen en Blauw in het midden mengen - dit is waar de AI fouten zou kunnen maken (de *Decision Boundary*). ```py import matplotlib.pyplot as plot from sklearn.datasets import load_iris # 1. Laad Data iris = load_iris() f = iris.data l = iris.target names = iris.target_names # 2. Creëer Plot plot.figure(figsize=(10, 6)) colors = ['red', 'green', 'blue'] # 3. Loop door de soorten (species) en plot ze for i in range(3): # Plot Petal Length (kolom 2) vs Petal Width (kolom 3) # f[l == i, 2] betekent: Selecteer rijen waar label 'i' is, pak kolom 2 plot.scatter(f[l == i, 2], f[l == i, 3], color=colors[i], label=names[i]) plot.xlabel('Petal Length (cm)') plot.ylabel('Petal Width (cm)') plot.title('Iris Species Clusters') plot.legend() plot.show() ``` ### **5. Deel III: De Interactieve App** [Section titled “5. Deel III: De Interactieve App”](#5-deel-iii-de-interactieve-app) * Klassikale Activiteit: “De Onmogelijke Bloem” * Voer onmogelijke getallen in (bijv. 100cm lengte, 0.1cm breedte). * De AI zal nog steeds een antwoord geven! Dit leert ons dat AI **zelfverzekerd is, zelfs als het fout zit**. * Het classificeert op basis van wiskundige nabijheid, niet op basis van gezond verstand. ```py from sklearn.datasets import load_iris from sklearn.neighbors import KNeighborsClassifier # Setup iris = load_iris() model = KNeighborsClassifier(n_neighbors=3) model.fit(iris.data, iris.target) print("AI FLOWER PREDICTOR READY") print("Voer metingen in (cm):") val1 = input("Sepal Length: ") val2 = input("Sepal Width: ") val3 = input("Petal Length: ") val4 = input("Petal Width: ") # Input omzetten naar een 2D list voor het model features = [[float(val1), float(val2), float(val3), float(val4)]] pred = model.predict(features) print(f"Prediction: {iris.target_names[pred[0]].upper()}") ``` ### **6. Deel IV: Externe Datasets** [Section titled “6. Deel IV: Externe Datasets”](#6-deel-iv-externe-datasets) In de praktijk zitten datasets niet ingebouwd in Python. Data Scientists downloaden vaak **CSV-bestanden** van platforms zoals [Kaggle](https://www.kaggle.com/). Om externe data in te laden, gebruiken we de bibliotheek **Pandas**. #### **Hoe download je data van Kaggle?** [Section titled “Hoe download je data van Kaggle?”](#hoe-download-je-data-van-kaggle) 1. Maak een account aan op [Kaggle.com](https://www.kaggle.com). 2. Zoek naar een dataset (bijv. “Heart Disease UCI”). 3. Ga naar **Input** tab en klik op de **Download** knop (meestal rechtsboven). 4. Je krijgt een `.zip` bestand. Unzip dit uit. 5. Zet het `.csv` bestand (bijv. `heart.csv`) in dezelfde map als je Python script. Hier is een voorbeeld van hoe je een CSV-bestand zou inladen en gebruiken: ```py import pandas as pd from sklearn.model_selection import train_test_split from sklearn.neighbors import KNeighborsClassifier from sklearn.metrics import accuracy_score # 1. Laad de CSV met Pandas # Stel je hebt een bestand 'heart.csv' gedownload van Kaggle df = pd.read_csv('heart.csv') # Bekijk de eerste paar rijen print(df.head()) # 2. Selecteer Features (f) en Target (l) # Stel we willen voorspellen of iemand hartziekte heeft (kolom 'target') # We droppen de target kolom uit f, zodat f alleen de features bevat f = df.drop('target', axis=1) l = df['target'] # 3. De standaard ML flow (hetzelfde als voorheen) f_train, f_test, l_train, l_test = train_test_split(f, l, test_size=0.2, random_state=42) model = KNeighborsClassifier(n_neighbors=5) model.fit(f_train, l_train) score = accuracy_score(l_test, model.predict(f_test)) print(f"Accuracy op externe data: {score * 100:.2f}%") ``` ## Assignment [Section titled “Assignment”](#assignment) **Onderwerp:** De Wijnkenner (The Wine Connoisseur) **Instructies:** 1. Nu je bloemen onder de knie hebt, ben je ingehuurd door een wijngaard. 2. In plaats van `load_iris`, importeer je `load_wine` van `sklearn.datasets`. 3. De Wine dataset probeert de “Class” van een wijn te raden op basis van **13 ingrediënten** (Alcohol, Malic Acid, Ash, etc.) in plaats van 4 bloemmetingen. 4. **Taak:** Pas de code van “Deel I” aan om de wijn-data te laden, te splitten, een KNN model te trainen en de *Accuracy Score* te printen. ## Toy Datasets [Section titled “Toy Datasets”](#toy-datasets) | Naam Dataset | Python Functie | Type Probleem | Beschrijving | | :---------------- | :--------------------- | :------------ | :------------------------------------------------------------------------ | | **Iris** | `load_iris()` | Classificatie | Classificatie van 3 soorten bloemen op basis van bloembladmetingen. | | **Wine** | `load_wine()` | Classificatie | Herkennen van 3 verschillende wijncultivars uit Italië. | | **Digits** | `load_digits()` | Classificatie | Herkennen van handgeschreven cijfers (lage resolutie 8x8 afbeeldingen). | | **Breast Cancer** | `load_breast_cancer()` | Classificatie | Medische diagnose (kwaadaardig vs. goedaardig) op basis van celkenmerken. | | **Diabetes** | `load_diabetes()` | Regressie | Voorspellen van ziekteprogressie na één jaar. |
# K-Nearest Neighbors
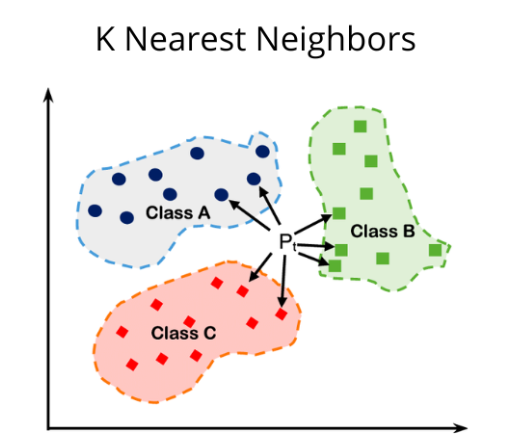 **K-Nearest Neighbors**, vaak afgekort als **KNN**, is een van de meest fundamentele en intuïtieve algoritmes binnen Machine Learning. *** ## 1. Wat is het? [Section titled “1. Wat is het?”](#1-wat-is-het) KNN is een algoritme voor **Supervised Learning**. In tegenstelling tot veel andere algoritmes, leert het niet door een complex model te trainen, maar door de data simpelweg te onthouden (“Lazy Learner”). Het wordt gebruikt voor twee hoofdtaken: * **Classificatie:** Het voorspellen van een categorie (bijv. *Is deze e-mail spam of niet?*). * **Regressie:** Het voorspellen van een numerieke waarde (bijv. *Wat is de geschatte huizenprijs?*). ## 2. Hoe werkt het? [Section titled “2. Hoe werkt het?”](#2-hoe-werkt-het) Stel je wilt een nieuw datapunt (een nieuwe waarneming) classificeren. Het algoritme volgt deze stappen: 1. **Kies de parameter K:** Bepaal het aantal buren (`K`) waarnaar gekeken moet worden (bijvoorbeeld `K=5`). 2. **Bereken de afstand:** Het algoritme berekent de afstand tussen het nieuwe punt en *alle* andere punten in de dataset. De meest gebruikte methode is de **Euclidische afstand**: ```py d(x, y) = sqrt{sum_{i=1}^{n} (x_i - y_i)^2} ``` 3. **Vind de dichtstbijzijnde buren:** Selecteer de `K` punten met de kleinste afstand tot het nieuwe punt. 4. **Maak de beslissing:** * *Bij Classificatie:* Laat de buren stemmen (“Majority Voting”). De categorie die het meest voorkomt onder de buren wint. * *Bij Regressie:* Bereken het gemiddelde van de waarden van de buren. ## 3. De cruciale rol van K [Section titled “3. De cruciale rol van K”](#3-de-cruciale-rol-van-k) De keuze van `K` bepaalt de prestaties van het model: * **K is te klein (bijv. K=1):** Het model is erg gevoelig voor ruis (noise). Een toevallige uitschieter kan de voorspelling direct fout maken (Overfitting). * **K is te groot:** Het model wordt te vlak en mist de lokale structuren en nuances in de data (Underfitting). * **Tip:** Kies vaak een **oneven getal** voor $K$ (3, 5, 7) om een gelijkspel (stakende stemmen) bij classificatie te voorkomen. ## 4. Voor- en Nadelen [Section titled “4. Voor- en Nadelen”](#4-voor--en-nadelen) | Voordelen | Nadelen | | :-------------------------------------------------------------------------------------- | :----------------------------------------------------------------------------------------------------------------------------------------------------------------------------------------------- | | **Eenvoudig:** Zeer makkelijk te begrijpen en uit te leggen aan niet-technische mensen. | **Traag bij veel data:** Omdat het voor elke voorspelling de afstand tot *alle* punten moet berekenen, is het traag bij grote datasets. | | **Geen trainingstijd:** Het opslaan van de data *is* de training. | **Gevoelig voor schaal:** Variabelen met grote getallen (bv. salaris van 50.000) domineren variabelen met kleine getallen (bv. leeftijd van 30). **Normalisatie** (scaling) van data is vereist. | | **Flexibel:** Kan zowel lineaire als niet-lineaire relaties aan. | **Geheugenintensief:** De hele dataset moet in het geheugen geladen blijven. | ## 5. Voorbeeld [Section titled “5. Voorbeeld”](#5-voorbeeld) **Movie Recommendation System** Streaming platforms zoals Netflix of Spotify gebruiken principes die lijken op KNN. Stel dat jij de films *The Matrix* en *Inception* leuk vindt. Het algoritme zoekt andere gebruikers (“buren”) die deze films óók leuk vonden. Als de meerderheid van die buren vervolgens de film *Interstellar* hoog waardeert, zal het algoritme *Interstellar* aan jou aanbevelen. ## 6. Implementatie (Scikit-Learn) [Section titled “6. Implementatie (Scikit-Learn)”](#6-implementatie-scikit-learn) Hieronder een voorbeeld met de bekende Iris-dataset. ```py from sklearn.datasets import load_iris from sklearn.model_selection import train_test_split from sklearn.preprocessing import StandardScaler from sklearn.neighbors import KNeighborsClassifier from sklearn.metrics import accuracy_score # 1. Data laden iris = load_iris() X = iris.data y = iris.target # 2. Data splitsen in training en test set (80% training, 20% test) X_train, X_test, y_train, y_test = train_test_split(X, y, test_size=0.2, random_state=42) # 3. Data schalen (CRUCIAAL voor KNN) # Omdat KNN met afstanden werkt, moeten alle features dezelfde schaal hebben. scaler = StandardScaler() X_train = scaler.fit_transform(X_train) X_test = scaler.transform(X_test) # 4. Model initialiseren en trainen # We kiezen K=5 knn = KNeighborsClassifier(n_neighbors=5) knn.fit(X_train, y_train) # 5. Voorspellen y_pred = knn.predict(X_test) # 6. Evalueren accuracy = accuracy_score(y_test, y_pred) print(f"Nauwkeurigheid van het model: {accuracy * 100:.2f}%") ```
# Libraries
This pagina laat zien hoe je met third-party libraries in Python werkt. ## Installeren en importeren van libraries [Section titled “Installeren en importeren van libraries”](#installeren-en-importeren-van-libraries) Gebruik per project een virtual environment (bijv. `.venv`) ```sh python -m venv .venv # Windows Command Prompt .venv\Scripts\Activate.bat # Windows PowerShell .venv\Scripts\Activate.ps1 ``` Installeer met pip en importeer de library daarna in je code: ```sh pip install numpy ``` ```py import numpy as np print(np.__version__) ``` ## Veelgebruikte libraries [Section titled “Veelgebruikte libraries”](#veelgebruikte-libraries) * [NumPy](https://numpy.org/): Numerieke data vormt de kern van veel AI-berekeningen. NumPy (Numerical Python) is de fundamentele library die ondersteuning biedt voor arrays, matrices en een breed scala aan wiskundige bewerkingen. * [Pandas](https://pandas.pydata.org/): Bij het werken met gestructureerde data is Pandas onmisbaar. Het maakt het eenvoudig om datasets te manipuleren, schoon te maken en te analyseren met een intuïtieve syntax. * [Matplotlib](https://matplotlib.org/) & [Seaborn](https://seaborn.pydata.org/): Data-visualisatie is een essentieel onderdeel van elke AI-workflow. Matplotlib is de basis plotting-library, terwijl Seaborn daarop voortbouwt voor aantrekkelijke en informatieve statistische visualisaties. * [scikit-learn](https://scikit-learn.org/stable/): Als je AI-project meer leunt op klassieke machine learning in plaats van diepe neurale netwerken, is scikit-learn onmisbaar. Het is gebouwd bovenop NumPy, SciPy en matplotlib. * [PyTorch](https://pytorch.org/): PyTorch is een open-source deep learning framework ontwikkeld door Meta AI, bekend om zijn flexibiliteit en gebruiksgemak. Het stelt ontwikkelaars in staat neurale netwerken te bouwen en te trainen met Python, en is populair voor toepassingen in computer vision en natural language processing. ## NumPy [Section titled “NumPy”](#numpy) NumPy wordt gebruikt voor numerieke berekeningen met arrays. ```sh pip install numpy ``` ```py import numpy as np # Maak een array arr = np.array([1, 2, 3, 4, 5]) # Basisbewerkingen print(arr * 2) # [2 4 6 8 10] print(arr.mean()) # 3.0 print(np.zeros((2, 2))) # 2x2 matrix van nullen ``` ## Pandas [Section titled “Pandas”](#pandas) Pandas is essentieel voor datamanipulatie en -analyse met behulp van DataFrames. ```sh pip install pandas ``` ```py import pandas as pd # Maak een DataFrame data = { 'Name': ['Alice', 'Bob', 'Charlie'], 'Age': [25, 30, 35], 'City': ['New York', 'Paris', 'London'] } df = pd.DataFrame(data) # Inspecteer data print(df.head()) # Selecteer een kolom print(df['Age']) # Filter data adults = df[df['Age'] > 28] print(adults) ``` ## Matplotlib [Section titled “Matplotlib”](#matplotlib) Matplotlib is de standaardbibliotheek voor het maken van visualisaties. ```sh pip install matplotlib ``` ```py import matplotlib.pyplot as plt x = [1, 2, 3, 4, 5] y = [2, 4, 6, 8, 10] plt.plot(x, y) plt.title("Eenvoudige Lijngrafiek") plt.xlabel("X-as") plt.ylabel("Y-as") plt.show() ``` ## Scikit-learn [Section titled “Scikit-learn”](#scikit-learn) Scikit-learn biedt tools voor machine learning. Hier is een eenvoudig voorbeeld van lineaire regressie. ```sh pip install scikit-learn ``` ```py from sklearn.linear_model import LinearRegression import numpy as np # Voorbeelddata (X moet 2D zijn) X = np.array([[1], [2], [3], [4], [5]]) y = np.array([2, 4, 6, 8, 10]) # Maak en train het model model = LinearRegression() model.fit(X, y) # Voorspel prediction = model.predict([[6]]) print(f"Voorspelling voor 6: {prediction[0]}") # Zou dicht bij 12 moeten liggen ```
# Setup
## Python Distributions [Section titled “Python Distributions”](#python-distributions) * [CPython](https://www.python.org/downloads/): the standard version (implementation) * [Anaconda](https://www.anaconda.com/download): for data science ## Code Editor [Section titled “Code Editor”](#code-editor) * [Visual Studio Code](https://code.visualstudio.com/): the open source AI code editor ## Tools [Section titled “Tools”](#tools) * [JupyterLab](https://jupyter.org/): web-based interactive development environment for notebooks, code, and data. * [Google Colab](https://colab.research.google.com/): free, cloud-based platform that allows users to write and execute Python code in a Jupyter Notebook environment.